Hey everybody, I've been having fun with a new implementation of statsgraph for everybody!
Some interesting graphs:
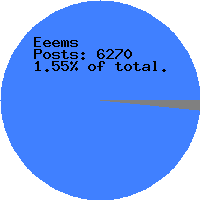
Pie char showing user post percentage of the entire sites posts:
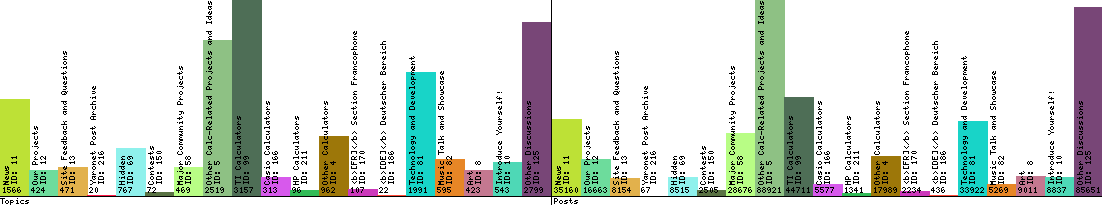
Bar graph show post/topic counts for different boards:
A re-implementation of the original timeline:

I'll post updates here when I add new features.

